Tableau Practice (3)
I created a cross tab using Tableau. I used sample data from Tableau
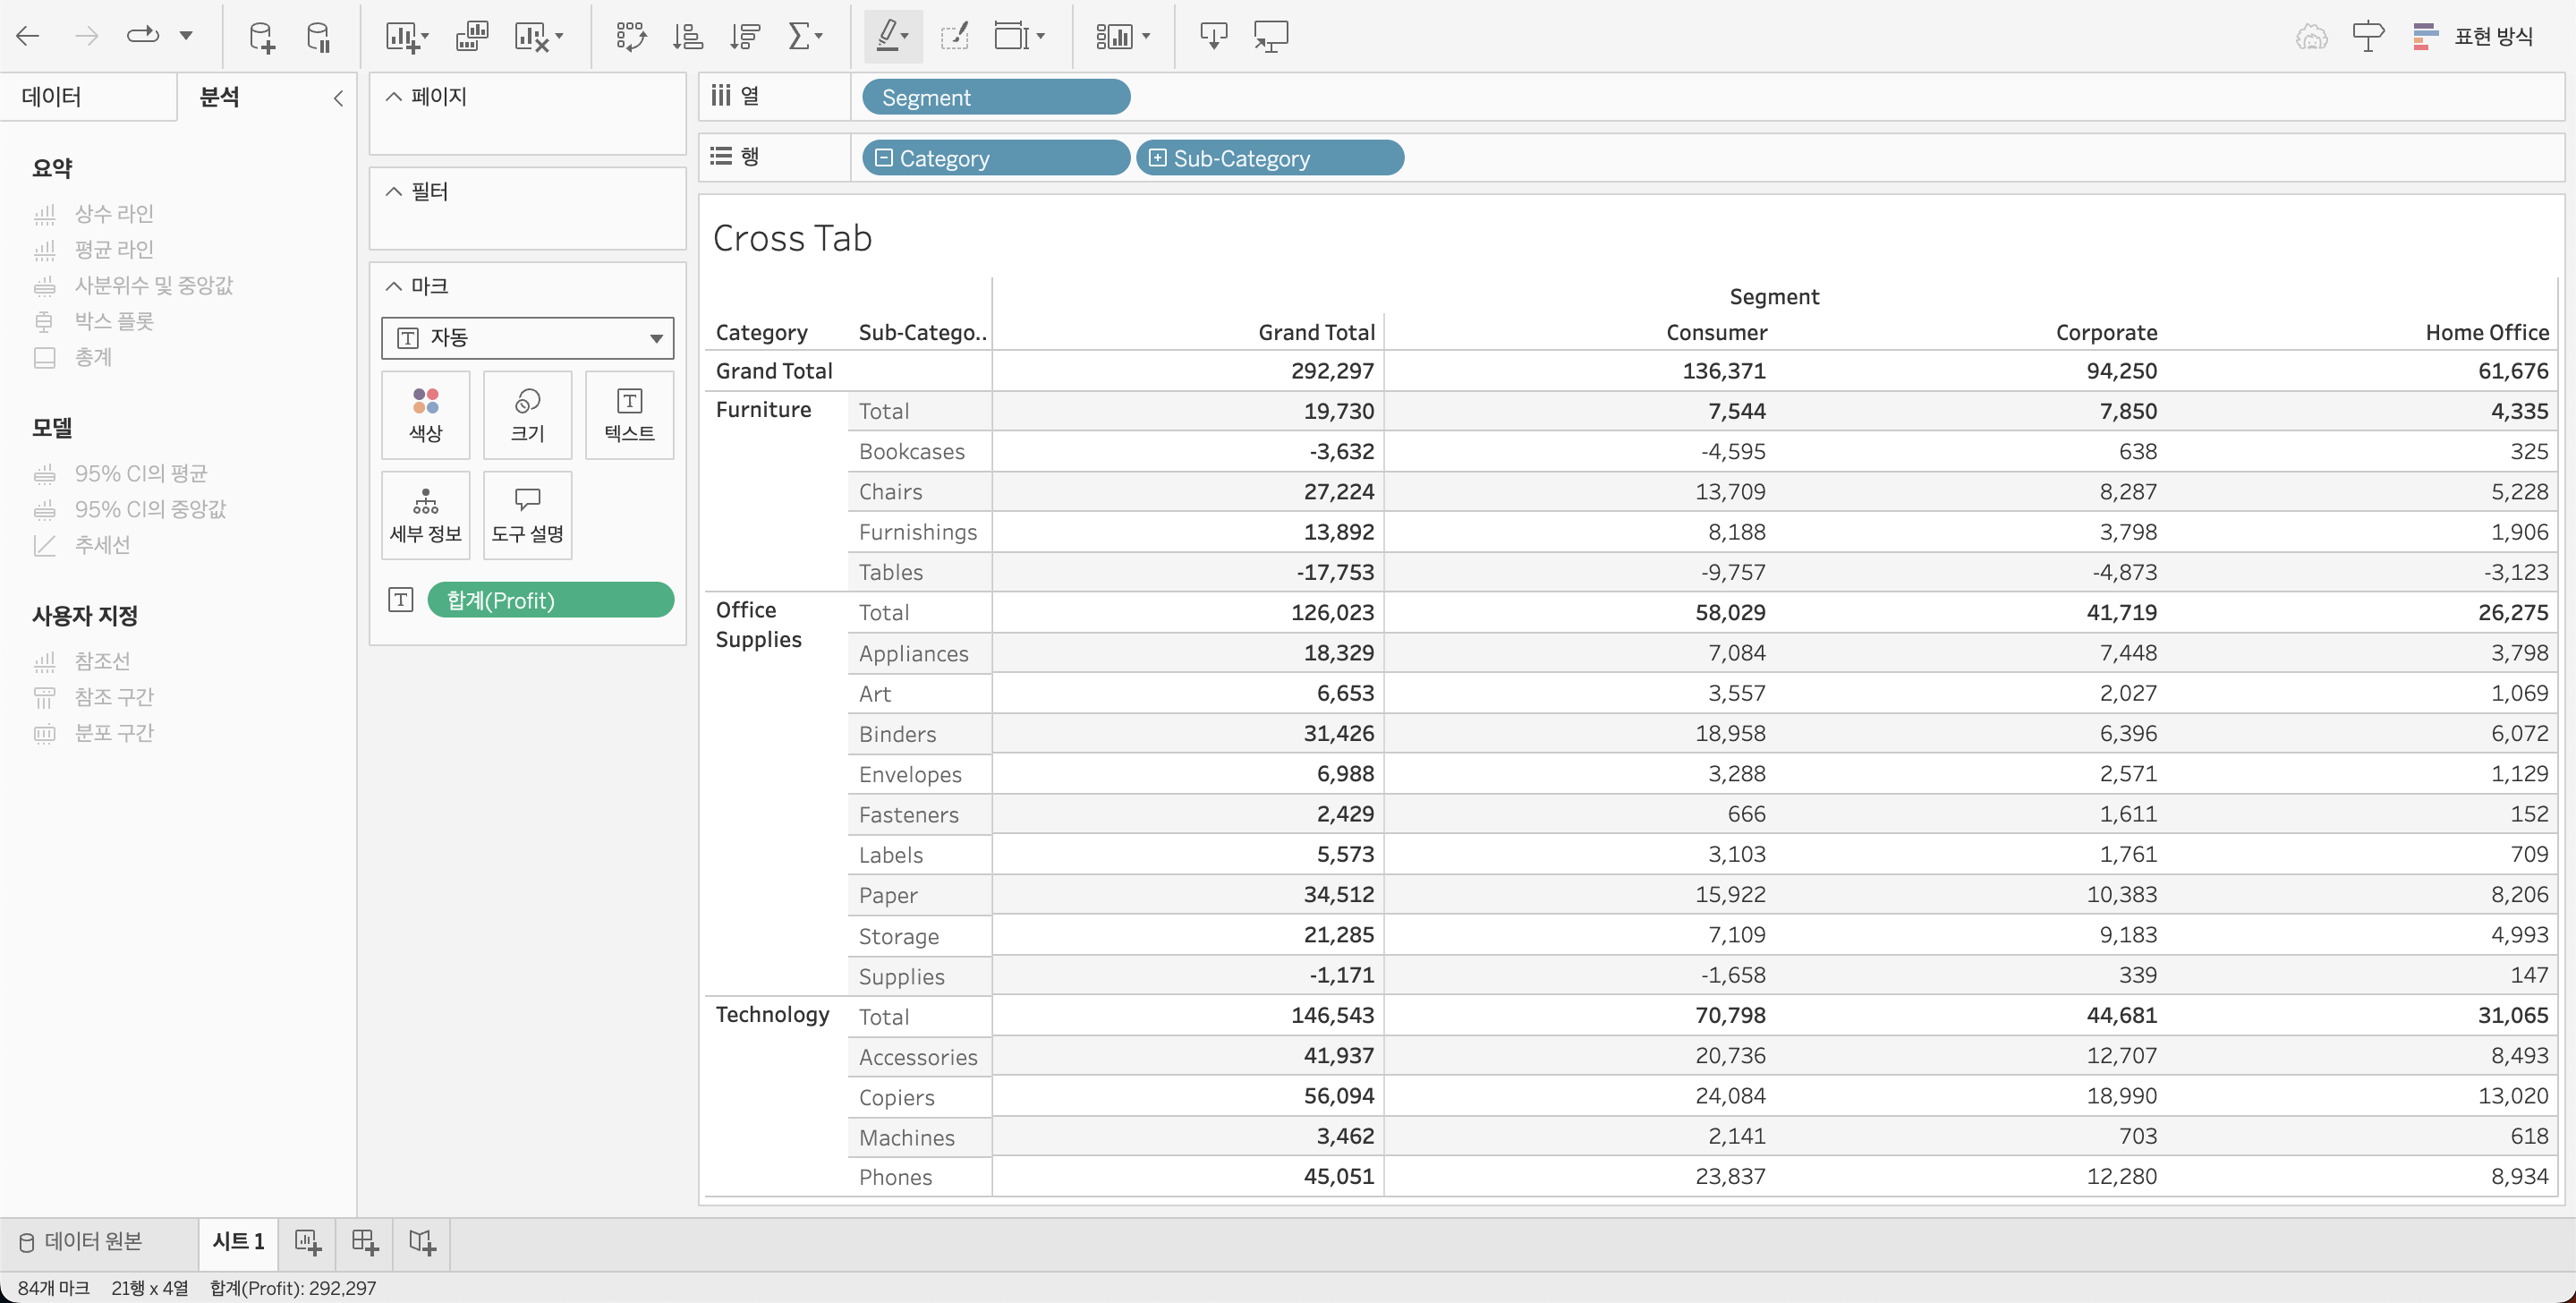
Tableau - Cross Tab
Cross Tab of Sales by Product and Customer Segment Using Tableau
I created a cross tab in Tableau to visualize sales by product and customer segment.
A cross tab organizes data into rows and columns, making it easy to compare the sales performance of each product across different customer segments.
What is a Cross Tab?
A cross tab is a table that arranges data into rows and columns.
Each cell in the table represents the intersection of two variables.
In this case, products are arranged in rows, and customer segments are arranged in columns, displaying the sales at each intersection.
Features of a Cross Tab
Concise Data Representation : Cross tabs provide a compact format to compare multiple variables at a glance, making it ideal for structured data analysis.
Intuitive Comparison : It allows for straightforward comparison of sales across different products and customer segments, helping to identify relationships between variables.
Versatile Application : Cross tabs are effective for analyzing both numerical and categorical data, and they offer a clear view of summarized statistics.
Advantages of Cross Tabs
Clear Data Structure : Cross tabs systematically organize data, making it easy to compare variables and gain insights into the data structure.
Detailed Analysis : They are well-suited for analyzing numerical data like sales figures, allowing for precise examination of each variable’s contribution.
Flexible Usage : Cross tabs offer flexibility by summarizing data while also allowing for drill-down analysis into more detailed data, providing deeper insights.
Disadvantages of Cross Tabs
Reduced Readability with Complex Data : As the number of categories increases, cross tabs can become cluttered and harder to read, especially when there are too many rows and columns.
Lack of Visual Appeal : Unlike bar charts or pie charts, cross tabs lack immediate visual impact and do not easily highlight patterns or trends in the data.
I referred to this youtube video for guidance.